P-value & CI Simulation Calculator
Try it yourself: explore sampling variability live with EvoClinical’s P-value & CI Simulation.
P-value & CI Simulator
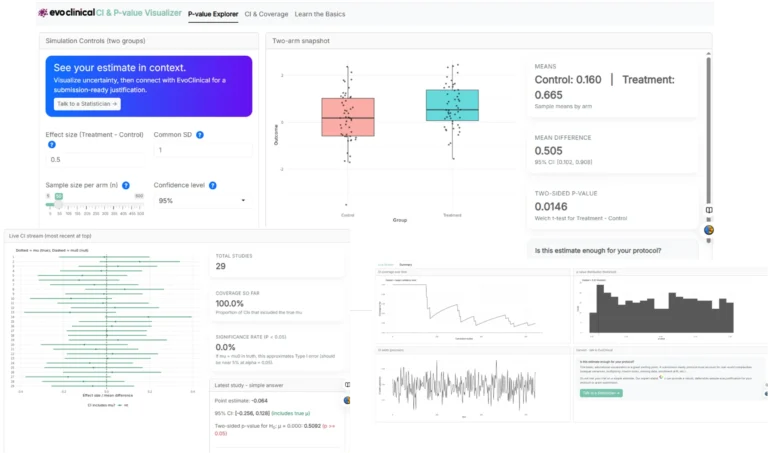
The P-value and CI stream simulates one “study” at a time from a simple model, drawing a CI and reporting the p-value. By adjusting the true effect, variance, sample size, and CI level, you can watch:
- Coverage converge toward the nominal level (e.g., 95%),
- CI width shrink as n increases,
- Significance rate rise as the true effect departs from the null.
- Useful snapshot for what “precision” and “evidence against the null” look like in repeated trials.
Use For Data Analysis
Already collecting data or approaching database lock?
Use the app to rehearse interpretation and communicate results.Enter the observed difference, variability, and planned sample size n to preview the confidence interval width you can expect and how often nearby assumptions would yield p-values below 0.05.The tool highlights that a single p-value is one draw, while the interval shows magnitude and uncertainty that matter to clinicians and reviewers.It will not replace a validated, audit-ready analysis, but it lets you try the logic before you hire a team so you can scope the work, anticipate questions, and engage us with a clear brief.
Use For Clinical Study Design
Use this simulator app early to pressure-test your plan.Set a realistic effect size, expected variability, and candidate sample sizes, then see how the p-value and confidence interval move together.The live CI stream shows coverage in action so you can judge precision, Type I error behavior, and how small shifts in assumptions change your chance of crossing 0.05.Teams use it to align investigators and budget holders, compare design scenarios, and spot underpowered settings before they become protocol risks.
Is this estimate enough for your protocol?
Simulations do not equal Real World
This educational visualization is a great starting point. However, a submission-ready protocol must account for real-world complexities (unequal variances, multiplicity, interim looks, missing data, enrollment drift, etc).
Reduce Risk
Do not risk your trial on a simple estimate. Our expert statisticians can provide a robust, defensible sample size justification for your protocol or grant submission.
Discuss Your Protocol with Experts
When you are ready to move from visualization to justification, the expert statistical team at EvoClinical is happy to discuss your next protocol to see where we can help.
P Value & CI Simulator
FAQs
What is a P Value?
A p-value is the probability of getting results at least as extreme as those seen in a study, if no real effect or difference exists—the null hypothesis holds true. In clinical trials, it helps assess if a drug’s benefits over placebo, like better survival rates, likely stem from chance alone.
How do I interpret P Values?
Compare the p-value to a threshold like 0.05: below it means strong evidence against no effect, calling results statistically significant. A p-value of 0.03 suggests only a 3% chance of the observed tumor shrinkage difference occurring randomly, while 0.20 indicates results fit well with no real difference.
What are limitations of P Values?
P-values ignore effect size and clinical relevance—a tiny p in a huge trial might flag irrelevant changes, like a 1% side effect bump. They risk misuse through p-hacking or assuming model assumptions hold, and do not prove causation or rule out the null.
Can p-value be negative?
No, p-values range from 0 to 1; negative values signal computational errors, as probabilities cannot be less than zero.
What does a high p-value mean?
A high p-value, like 0.70, means observed results align well with the null hypothesis—insufficient evidence rejects no effect, but it does not confirm the null or rule out smaller true effects.
What does a low p-value mean?
A low p-value, such as 0.01, indicates results unlikely under the null—strong evidence for an effect, though not its size, direction, or causality.
Is p < 0.05 always proof of a real treatment effect?
No, p < 0.05 only rejects the null hypothesis at the 5% level, indicating low chance of the result under no effect; it risks false positives (Type I error) and ignores effect magnitude or clinical relevance.
Does sample size affect p-values in clinical trials?
Yes, larger samples reduce p-values for the same effect size, potentially deeming trivial differences significant, while small samples may miss real effects despite low p-values in powered studies.